Analytical Method Development and Validation of Carbimazole by Using RP-HPLC on Bulk Drug and Marketed Formulation
Kanchan R Pagar*, DG Phadtare
Department of Analytical chemistry, RG Sapkal Institute of Pharmacy, Anjaneri, Nashik
- *Corresponding Author:
- Kanchan R Pagar, Department of Analytical chemistry, RG Sapkal Institute of Pharmacy, Anjaneri, Nashik, Tel: 56778543446; E-mail: Kanchan.pagar@sapkalknowledg eub.org
Received date: February 07, 2022, Manuscript No. IPJOIC-22-12658; Editor assigned date: February 10, 2022, PreQC No. IPJOIC-22-12658 (PQ); Reviewed date: February 25, 2022, QC No. IPJOIC-22-12658; Revised date: April 11, 2022, Manuscript No. IPJOIC-22-12658 (R); Published date: April 19, 2 022, DOI: 10.36648/2472-1123.8.4.022
Citation: Pagar KR, Phadtare DG (2022) Analytical Method Development and Validation of Carbimazole by Using Rp-Hplc on Bulk Drug and Marketed Formulation. J Org Inorg Chem Vol:8 No:4
Abstract
The goal of the present study was to develop and validate of an analytical method for the evaluation of Clotrimazole in bulk form. UV-VIS spectroscopic technique was used for the estimation of Clotrimazole. Organic solvents and chemicals were used as trial diluents. The selection of the diluents was carried out on the basis of solubility and stability factors upon which drug was fully solubilised and stable for sufficient time. The drug was slightly soluble in water and acetonitrile, Soluble in Methanol and Alcohol. Clotrimazole showed absorption maxima (λ max) at 263 nm. The recovery studies were established the accuracy of the proposed method and the results were validated as per ICH guidelines. Linearity was obtained by concentration versus absorbance for Clotrimazole with correlation coefficient rê??0.999. Robustness of the method was calculated as the % RSD for peak area was calculated which should be less than 2%.The LOD and LOQ were calculated as 0.000228 (μg/mL), 0.00775 (μg/mL) respectively. The result analysis was validated statistically and recovery studies confirmed the accuracy and precision of the proposed method. The developed method can effectively be applied for the quality control analysis and determination of Clotrimazole in tablet dosage form.
Keywords
Clotrimazole; HPLC method; Validation; Stability indicating; ICH guidelines
Introduction
Analytical chemistry deals with method of determining the chemical composition of sample. It is primarily concerned about determining the qualitative and quantitative composition of material. A qualitative method yields information about the identity of atomic or molecular species or functional group in the sample. A quantitative method in contrast provides numerical information as to the relative amount of one or more of these components. It is a scientific discipline used to study the chemical composition, structure and behavior of matter. The term chemical analysis may be defined as the application of a process or series of process to identify or quantify a substance, the component of a solution or mixture or the structure of chemical compounds. The purpose of chemical analysis is to gather and interpret chemical information that will be of value to society in wide range of contexts. It is involved in all the stages related to a drug, from its discovery, development, action, safety, formulation, use, quality control, packaging, storage, marketing etc. Any drug or dosage form for human use must have excellent quality and purity, free from impurities. This dosage form directly affects the human life and behavior so their analysis is important which is carried out using analytical methods. Analytical method development is the heart of analytical chemistry. It involves development and validation of new analytical method for the purpose of testing samples. Sample testing is done by using UV, IR, HPLC, HPTLC, GC-MS, and LC-MS etc. Analytical chemistry has since long, occupied an important in the development of science and technology. It is very broad and embraces a wide range of natural, chemical and instrumental technique and procedure [1].
Chromatographic technique
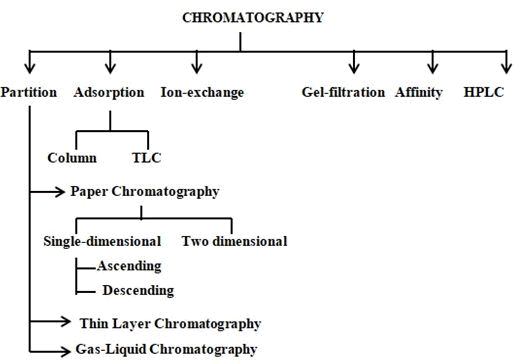
Chromatography was invented and named by Russian botanist MikhaiTswett. Chromatography according to USP can be defined as a procedure by which solutes are separated by a differential migration process in a system consisting of two or more phases, one of which moves continuously in a given direction and in which the individual substances exhibit different mobilities by reason of differences in adsorption, partition, solubility, vapor pressure, molecular size, or ionic charge density. One of the phases is a fixed bed of large surface area, whereas the other is a fluid that moves through or over the surface of the fixed phase (Figure 1) [2].
High Performance Liquid Chromatography (HPLC)
High performance liquid chromatography (HPLC) is the most versatile and widely used analytical technique. It utilizes a liquid mobile phase to separate the components of mixture. These components (or analyses) are first dissolved in a solvent, and then forced to flow through a Chromatographic column under high pressure. In the column, the mixture is resolved into its components. The interaction of solute with mobile and stationary phases can be manipulated through different choices of both solvent and stationary phases. As a result, HPLC acquires a high degree of versatility not found in other chromatographic systems and it has the ability to separate a wide variety of chemical mixtures. HPLC uses high pressure to force solvent through closed columns containing very fine particles that gives high resolution separations.
The technique is used to separate and determine species in a variety of organic, inorganic, and biological materials. HPLC is used either in the liquid-solid adsorption chromatography mode or the liquid-liquid partition chromatography mode, either normal or reversed phase. Both partition and adsorption chromatography operates on differences in solute polarity since polarity is important in determining both adsorption and solubility. As a general rule, highly polar materials are best separated using partition chromatography, while very non polar are separated using adsorption chromatography [2-4].
Types of HPLC
- Normal phase HPLC
- Reversed phase HPLC
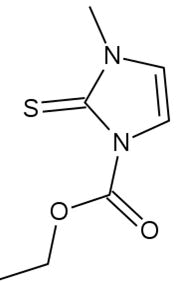
Carbimazole is an aitithyroid agent that decreases the uptake and concentration of inorganic iodine by thyroid; it also reduces the formation of di-iodotyrosine and thyroxine. Once converted to its active form of methimazole, it prevents the thyroid peroxidase enzyme from coupling and iodinating the tyrosineresidues on thyroglobulin, hence reducing the production of the thyroid hormones T3 and T4 (Figure 2).
Brand name: Neomercazole
Molecular formula:C7H10N2O2S [5-6].
Molecular weight: 186.229 g/mol
IUPAC name: ethyl 3-methyl-2-sulfanylidene-imidazole-1-carboxylate
Melting point: 121-123°C
Materials and Methods
Pharmaceutical grade carbimazole was supplied by Taj mahal chemicals, India and used without further purification. All the chemicals used are of HPLC and AR grade. Chemicals used are as Methanol (SDFC Chem lab), 0.05% buffer TEAwith OPA water pH3 (Research chem lab) and the carbon dioxide free double distilled water for HPLC purpose.
Instruments
FTIR made from Bruker having software OPUS 7.5, UV-Visible double beam spectrophotometer Shimadzu (UV 1800) is used for the analysis. The HPLC system consisted of a pump is GRADIENT PUMP and the column used are (Cosmosoil) C18 Column (4.6 mm × 250 mm) for the validation studies. The ultrasonicator (model- ICO 900/2000) I used.
Chromatographic conditions
Accurately weigh and transfer 10 mg Carbimazole working standard into 10 ml volumetric flask as about dilute Methanol prepared in completely and make volume up to the mark with the same solvent to get 1000 µg/ml standard (stock solution) and 15 min sonicated to dissolve it and from the resulting solution 0.1 ml was transferred to 10 ml volumetric flask and the volume was made up to the mark with mobile phase methanol: buffer (0.05% TEA with OPA pH adjusted 3) Water solvent. The resulting 10 µg/ml of solution was subjected to chromatographic analyses using mobile phases of different strengths with chromatographic conditions mentioned below:
Analytical column: Cosmosil C18 Column (250 mm x 4.6 mm, 5 µm partical size
Injection volume: 20 µl
Flow rate: 0.7 ml/min
Mobile phase: Methanol: buffer (90:10% V/V) pH3 adjust with OPA
Detection: 257 nm
Run time: 10 min
Standard stock solution
Accurately weight and transfer 10 mg Carbimazole working standard into 10 ml volumetric flask as about diluent Methanol completely and make volume up to the mark with the same solvent to get 1000 µg/ml standard (stock solution) and 15 min sonicated to dissolve it and the resulting stock solution 0.1 ml was transferred to 10 ml volumetric flask and the volume was made up to the mark with mobile phase methanol: buffer(0.05% TEA (OPA pH 3)) prepared in (90 ml MEOH: 10 ml BUFFER v/v) solvent.
Validation of method for analysis of Carbimazole
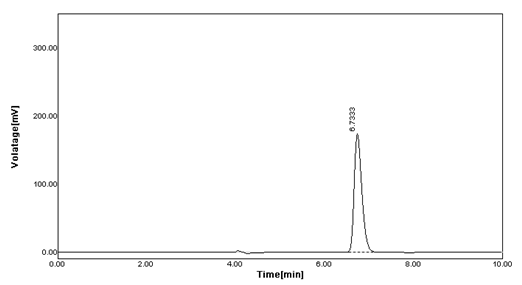
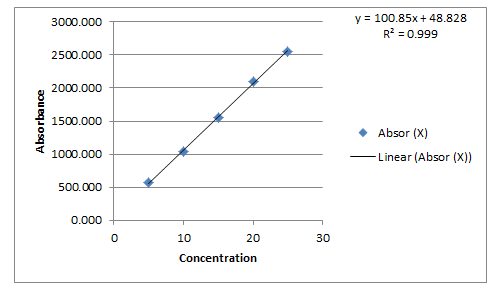
Linearity: From Carbimazole standard stock solution, different working standard solution (5-25 μg/ml) were prepared in mobile phase 20 μl of sample solution was injected into the chromatographic system using mixed volume loop injector Chromatograms were recorded. The peak area was plotted against corresponding concentrations to obtain the calibration graph (Figure 3).
Precision: The method was established by analyzing various replicates standards of carbimazole all the solution was analyzed thrice in order to record any intra-day and inter-day variation in the result that concluded results are shown in (Tables 1,2)
Table 1: Intra-day Precision.
| Conc. (μg/mL) | Mean | SD ± | % RSD | |
|---|---|---|---|---|
| Morning | 10 | 97.92 | 0.2 | 0.21 |
| Evening | 10 | 97.88 | 0.087 | 0.089 |
Table 2: Inter-day Precision
| Conc. (μg/mL) | Mean* | SD ± | %RSD | |
|---|---|---|---|---|
| Day 1 | 10 | 98.06 | 0.12 | 0.122 |
| Day 2 | 10 | 97.95 | 0.062 | 0.063 |
Accuracy: Recovery studies were performed to validate the accuracy of developed method. To pre analyzed tablet solution, a definite concentration of standard drug (50%, 100%, and 150%) was added (Table 3).
Table 3: Statistical validation of recovery studies of carbimazole.
| Level of Recovery (%) | Drug | Mean % Recovery | Standard Recovery | % RSD |
|---|---|---|---|---|
| 50% | Carbimazole | 98.99 | 0.053 | 0.053 |
| 100% | Carbimazole | 101.89 | 0.023 | 0.023 |
| 100% | Carbimazole | 99.42 | 0.05 | 0.05 |
Robustness: The mobile phase composition was changed in (±1 ml/ min-1) proportion in the mobile phase composition, and the flow rate was (± 1 ml/ min-1) and the change in detection wavelength (± 1 ml/ min-1) and the effect of the results were examined. It was performed using 10 µg/ml solution of Carbimazole [7].
Detection limit: Based on the S.D. of the response and the slope of calibration curve, the Detection Limit (DL) was calculated as,

Where,
σ=The S.D. of the y-intercepts of regression lines.
S=The slope of the calibration curve.
The slope S may be estimated from the calibration curve and S.D. was used should be calculated from the y-intercepts of regression line in calibration curve.
Quantitation limit: Based on the S.D. of the response and the slope of calibration curve, the Quantitation Limit (QL) was calculated as,

Where,
σ=The S.D. of the y-intercepts of regression lines.
S=The slope of the calibration curve.
The slope S may be estimated from the calibration curve and S.D. was used should be calculated from the y-intercepts of regression line in calibration curve.
Ruggedness: It is the degree of reproducibility of the test result under the variety likes change in flow rate.
Results and Discussion
Optimization of chromatographic conditions
Several columns were used for optimizing the chromatographic condition. The parameters being focused were improvisation of retention time, separation of degradation products and column life. The columns provided good peak shapes and no peak splitting was observed with any impurity.
UV spectroscopy
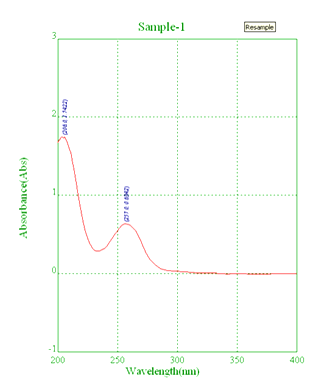
UV absorption of 10 µg/mL solution of Carbimazole in methanol was generated and absorbance was taken in the range of 200-400 nm. Λmax (Figure 4) [8].
Linearity: From Carbimazole standard stock solution, different working standard solution (5-25 μg/ml) were prepared in mobile phase 20 μl of sample solution was injected into the chromatographic system using mixed volume loop injector Chromatograms were recorded (Figure 5) [9].
The calibration curve yielded correlation coefficient (r2) 0.999 and 0.999 for Carbimazole respectively.
Precision: The method was established by analyzing various replicates standards of Carbimazole all the solution was analyzed thrice in order to record any intra-day & inter-day variation in the result that concluded results are shown in (Table 2,3).
Accuracy: Recovery studies were performed to validate the accuracy of developed method. To pre analyzed tablet solution, a definite concentration of standard drug (50%, 100%, and 150%) was added. The result are shown in (Table 4)
Robustness: The Robustness of a method is its ability to remain unaffected by small deliberate changes in parameters. To evaluate the robustness of the proposed method, small but deliberate variations in the optimized method parameters were done. The effect of changes in mobile phase composition and flow rate, wavelength on retention time and tailing factor of drug peak was studied.
The mobile phase composition was changed in (± 1 ml/min-1) proportion and the flow rate was varied by of optimized chromatographic condition.Robustness parameters were also found satisfactory; hence the analytical method would be concluded. Results obtained are shown in (Table 4).
Table 4: Result of robustness study of carbimazole.
| Parameter | Conc. (µg/ml) | Area (mean ± SD) | %RSD |
|---|---|---|---|
| MP composition (89 ml+11 ml) Methanol+0.05% TEA water with OPA pH 3 | 5 | 526.41 ± 4.28 | 0.81 |
| MP composition (91 ml+09 ml) Methanol+0.05% TEA with (OPA) water pH 3 | 5 | 329.03 ± 6.48 | 1.65 |
| Wavelength change 256 nm | 5 | 496.4 ± 8.14 | 1.64 |
| Wavelength Change 258 nm | 5 | 447.52 ± 3.48 | 0.78 |
| Flow rate change (0.6 ml) | 5 | 474.72 ± 6.33 | 1.33 |
| Flow rate change (0.8 ml) | 5 | 486.7 ± 8.91 | 1.83 |
The changes were did flow rate (± 1 ml/ min-1), pH of mobile phase composition, and Wavelength. % RSD for peak area was calculated which should be less than 2%. The result shown in analytical method that concluded.
Limit detection
The LOD is the lowest limit that can be detected. Based on the S.D. deviation of the response and the slope the Limit of Detection (LOD) may be expressed as:
LOD=3.3 (SD)/s
=3.3 X 0.023/100.85
=0.000228
Where, SD=Standard deviation of Y intercept
S=Slope
The LOD of Carbimazole was found to be 0.000228 (μg/mL) analytical methods that concluded.
Limit quantification: The LOQ is the lowest concentration that can be quantitatively measured. Based on the S.D. deviation of the response and the slope,
The Quantitation Limit (LOQ) may be expressed as:
LOQ=10 (SD)/ S
=10 X 0.023/100.85
=0.00775
Where, SD=Standard deviation Y intercept
S=Slope
The LOQ of Carbimazole was found to be 0.00775 (μg/mL) analytical methods that concluded.
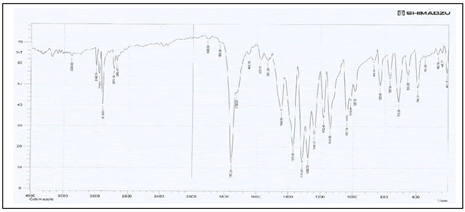
Ruggedness: Ruggedness was studied by different analyst. Results obtained are shown in Tables 5,6 and Figure 6.
Table 5: Data for ruggedness study of Carbimazole by HPLC.
| Sr.No | Analyst | Conc. (μg/mL) | Mean Area | SD ± | % RSD |
|---|---|---|---|---|---|
| 1 | Analyst Ι | 25 | 2553.92 | 1.045 | 0.04 |
| 2 | Analyst ΙΙ | 25 | 2557.06 | 1.52 | 0.059 |
Table 6: Interpretation of FTIR Spectrum of Carbimazole.
| Sr. No. | Functional group | Standard range (cm-¹) | Observed range (cm-¹) |
|---|---|---|---|
| 1 | C=S | Near 1200 cm-1 | 1203 |
| 2 | Thioimidazole ring | Near 1600 cm-1 | 1699.12 |
| 3 | C=O-O-C stretching | Between 1700-1500 cm-1 | 1428.28 |
| 4 | O-C Bond | Near 1300 cm-1 | 1312 |
| 5 | C-H | Between 2950-2840 cm-1 | 2600 |
| 6 | O-H Bond | Between 3600-2500 cm-1 | 3414.43 |
Conclusion
Simple, rapid, accurate and precise RP-HPLC have been developed and validated for the routine analysis of carbimazole in API and tablet dosage forms. Both methods are suitable for the simultaneous determination of carbimazole in Single-component formulations without interference of each other. The developed methods are recommended for routine and quality control analysis of the investigated drugs in two component pharmaceutical preparations. The amount found from the proposed methods was in good agreement with the label claim of the formulation. Also the value of standard deviation and coefficient of variation calculated were satisfactorily low, indicating the suitability of the proposed methods for the routine estimation of tablet dosage forms.
Acknowledgement
The author is thankful to the Principal of KCT’s R. G. Sapkal College of Pharmacy, Anjaneri, Nashik for providing the facilities at college.
Conflict of Interest
Authors declare that they donot have any conflict of interest.
References
- Kenkel J (2009) Analytical Chemistry for Technicians. (3rd Edition), Published By CRC Publication, 2-4.
- Willard HH, Merritt LL, Settle FA (1996) Instrumental methods of analysis. (7th Edition), CBS publishers and distributors Pvt Ltd, New Delhi.
- Skoog DA, Holler FJ, Crouch SR (2007) Principles of Instrumental Analysis. (6th Edition), Thomson Brook Publishers, USA.
- Snyder L, Kirkland J (1997) Practical HPLC Method Development. Wiley Intersciences a John Wiley and Sons publication,
- https://en.wikipedia.org/wiki/Carbimazole
- https://www.drugbank.ca/drugs/DB00389
- Mukul S, Afraim K, Abdul J (2017) A simple and effective method for determination of the antithyroid drug carbimazole using ruthenium trichloride. J Chem 41:995-1012
[Crossref] [Google Scholar] [Indexed]
- Moussa BA, El-Bagary RI, Osman EE (2013) Determination of letrozole in pharmaceutical preparation and human plasma based on fluorometric detection. Anal Chem Lett. 3:139-146.
[Crossref] [Google Scholar] [Indexed]
- Patel LJ, Suhagia BN, Shah PB, Shah RR (2006) RP-HPLC and HPTLC methods for the estimation of carvedilol in bulk drug and pharmaceutical formulations. Indian J Pharm Sci. 68:790-793.
Open Access Journals
- Aquaculture & Veterinary Science
- Chemistry & Chemical Sciences
- Clinical Sciences
- Engineering
- General Science
- Genetics & Molecular Biology
- Health Care & Nursing
- Immunology & Microbiology
- Materials Science
- Mathematics & Physics
- Medical Sciences
- Neurology & Psychiatry
- Oncology & Cancer Science
- Pharmaceutical Sciences
