Physical and Chemical Profiles of MDMA Tablets Seized in Indonesia
Tanti*, Carolina Tonggo Marisi Tambunan, Christien Andriyani Lalangi, Maimunah and Erlana Nindya Maulida
Department of Quality and Research, Drugs Testing Laboratory of National Narcotics Board (BNN) of the Republic of Indonesia, West Java, Indonesia
- *Corresponding Author:
- Tanti,
Department of Quality and Research,
Drugs Testing Laboratory of National Narcotics Board (BNN) of the Republic of Indonesia, West Java,
Indonesia,
E-mail: tanti.puslabbnn@gmail.com
Received date: September 30, 2022, Manuscript No. IPJOIC-22-14642; Editor assigned date: October 03, 2022, PreQC No. IPJOIC-22-14642 (PQ); Reviewed date: October 14, 2022, QC No. IPJOIC-22-14642; Revised date: October 24, 2022, Manuscript No. IPJOIC-22-14642 (R); Published date: November 01, 2022, DOI: 10.36648/2472-1123.8.6.32
Citation: Tanti, Tambunan CTM, Lalangi CA, Maimunah, Maulida EN (2022) Physical and Chemical Profiles of MDMA Tablets Seized in Indonesia. J Org Inorg Chem Vol.8 No.5:32
Abstract
Objective: During 2022, a total amount seizure of ecstasy reached 872 thousand tablets in Indonesia. Physical characteristics were recorded, but no data available regarding to the chemical profiles of those tablets. Chemical characterization is an initial stage to predict the plausible synthesis pathway and precursors used in the manufacturing process. Hence, profiling methodology of the ecstasy tablets which consist of physical and chemical characterization needs to be started. This study aimed to gather information from both examinations to the Pink Versace ecstasy tablets seized in Indonesia.
Methods: Physical examination addressed the shapes, colors, logos, coating and imprint descriptions, dimensions and weights of the ecstasy tablets. Sample extraction under alkaline condition of pH 12.80 and pH 10.18 were carried out to the tablets, and then the profiles of organic impurities were investigated by Gas Chromatography-Mass Spectrometry (GC-MS). Further investigation using Gas Chromatography-Flame Ionization Detector (GC-FID) was applied to measure the MDMA content in the ecstasy tablets.
Results: In this work, a total of 25 impurities were detected in typical GC chromatogram from two extraction methods. Safrole, isosafrole, piperonal and 3, 4-MDP2P were detected in samples, hence posed a challenge to determine the main precursor used. The presence of impurities 1-(3,4- Methylenedioxyphenyl)-2-propanol and 3,4- Methylenedioxy-N-methylbenzylamine suggested a reductive amination route of 3,4-MDP2P from piperonal, which presumably derived from safrole as main precursor.
Conclusion: Physical and chemical characteristics of the investigated tablets could be identified thus initiate a database of ecstasy tablet profiles in Indonesia.
Keywords
Ecstasy tablets; Pink versace; MDMA; Physical characteristics; Chemical profiles; Impurity analysis
Introduction
Ecstasy is the street name for 3, 4-MethyleneDioxy-N-Methyl Amphetamine (MDMA). It is most commonly encountered in tablet form with various sizes, weights, shapes, logos and colors. Data released by National Narcotics Board (BNN) shows a 43.44% drop in the amount of ecstasy tablets seized in Indonesia, from 1.543 million in 2020 to 0.872 million in 2021 [1,2]. The number of ecstasy samples analyzed in the center of narcotics laboratory is just about 0.84% in 2021. It is in the fourth place after methamphetamine (78.67%), marijuana (12.30%) and herbal blends of synthetic cannabinoids (8.05%). No clandestine laboratory of ecstasy has been dismantled in Indonesia for the past five years.
Ecstasy tablets, as well as pharmaceutical tablets, are composed by active substance (s) and many excipients such as diluents, binders, lubricants, disintegrators and dyes [3]. Ecstasy tablets may contain MDMA in high concentration as single compound. Meanwhile, other substances belong to amphetamine type stimulants (e.g. methamphetamine) or new psychoactive substances (e.g. Eutylone, N-ethylpentylone, 4- CEC, p-Fluorophenylpiperazine), ketamine or caffeine can be present as adulterants [4]. Consequently, MDMA content in tablets will vary. The average amount of MDMA hydrochloride in ecstasy tablet seized in UK was 58.7 ± 22.9 mg per tablet [5], and increased to 105 mg MDMA free-base per tablet in 2018 [6] (equivalent to approximately 125 mg MDMA hydrochloride). Compared to pharmaceutical drugs in tablet form, ecstasy produced in clandestine laboratory usually characterized by crude, fragile and mottled appearance because they may not contain each of excipients or use insufficient quantities of excipients required to obtain good appearance of tablets [3].
Physical characteristics of ecstasy tablets seized in Indonesia are very diverse oftentimes. It indicates that they may come from different sources with different chemical profiles, or even from one source/clandestine laboratory that using various punches and dyes to produce tablets in many physical appearances yet having similar chemical profiles [4]. Profiles of ecstasy tablets can be determined through drug profiling methodology which covers physical and chemical characterization [7].
Physical characterization consists of visual observation of the shapes, colors, logos, the packaging (if available) and measurement of the dimension of tablets. Chemical characterization is performed by analytical instrument to identify the impurities such as starting materials, intermediates and manufacturing by-products. By knowing the chemical profiles of tablet analyzed, the synthetic route and the precursor/starting material used in the manufacturing process can be determined. In the final investigation, both physical and chemical characterizations can determine link between seizures that will be very useful for intelligence purpose.
MDMA can be manufactured by four primary precursor chemicals: Safrole, isosafrole, piperonal and 3,4- methylenedioxyphenyl-2-propanone (3,4-MDP2P) [8,9]. Illicit production of MDMA often begins with safrole that undergo Wacker-Tsuji oxidation using PdCl2 yields the intermediate 3,4- MDP2P, and followed by reductive amination of 3,4-MDP2P to produce the final product of MDMA [10]. Moreover, reductive amination was reported as the most common synthetic route in manufacturing MDMA in Europe, with variation in the reduction process (e.g. Al/Hg, NaBH3CN, NaBH4 as reducing agent) [11].
Several papers have been described by-product impurities based on the synthetic routes [7,12]. In the present study, we gather information derived from visual inspection and chemical investigation of the Pink Versace ecstasy tablets submitted to our laboratory in July 2022, to link between the physical characteristic, synthetic production method and the potential precursor used. Characterization of ecstasy tablets was performed by Infrared (IR) spectroscopy and UV absorption analysis. Analytical methods using Gas Chromatography-Mass Spectrometry (GC-MS) were applied for impurities identification. Furthermore, we investigated MDMA content in ecstasy tablets using Gas-Chromatography-Flame Ionization Detector (GC-FID). The data derived from this study are supposed to enrich profiles of ecstasy tablets and could hopefully be used for precursor monitoring.
Materials and Methods
Materials
Diethylether (for analysis), n-heptane (for Liquid chromatography), methanol (hypergrade for LC-MS), Ammonia solution 25% (for analysis), Nitric acid 65% (for analysis), Sodium hydroxide pellets (for analysis), Sodium carbonate anhydrous (for analysis), Silver nitrate (for analysis). Those chemicals were purchased from Merck, Germany. Sodium bicarbonate was provided sigma-aldrich, USA. High purity water (18.2M ohm) was treated by Arium® water purification system (Sartorius, Germany).
Samples
The ecstasy tablets were seized by national narcotics board of south sumatera province (n=2000 Pink Versace tablets). Ten tablets have been submitted to center of narcotics laboratory for drug profiling purpose. Investigated tablets were initially directed to the physical characterization including shape, color (solid/mottled), logo, coating, imprint description, dimension and weight (Figure 1).

Figure 1: Pink Versace tablets.
Sample preparation
Chemical profiles analysis
UV absorption analysis: To analyze the UV absorption of the sample, MDMA standard and sample concentration of 1000 μg/ml and 2000 μg/ml in methanol, respectively, were prepared. Another sample preparation through the extraction method under pH 12.80 as reported by [13] was performed as comparison. 97.2 μl of each solution was sprayed on the TLC activated plates. Toluene: Acetone: Diethylamine (85:10:5 v/v/v) was used as developing solvent [14]. Chamber was saturated for about 30 minutes at ambient temperature before the migration. Plates were dried at room temperature for 5 minutes after the migration, and then dried at oven 70âÂðC for another 5 minutes to remove diethylamine. Spots of MDMA were detected under UV light at a wavelength of 200 nm-400 nm.
IR measurement: A small amount of the homogeneous powdered samples and standard were directly put on the diamond crystal without pretreatment. Before each measurement, a background check was applied to subtract any undesirable residual peaks such as atmospheric water vapor and carbon dioxide from the sample spectrum. After each measurement, the crystal was cleaned using a soft tissue moistened with ethanol and allowed to dry in room temperature.
Organic impurity analysis: Sample was extracted using diethyl ether and n-heptane as publication of [13] and [7], respectively.
Investigated tablets were ground into powder. An amount of sample equivalent to 10 mg of pure MDMA.HCl was weighed and dissolved in 3 ml of high purity water. 1M sodium hydroxide was added to the solution gradually to make a pH 12.80. The basic solution was shaken for 10 minutes at 220 rpm (Orbital laboratory shaker OL30, Ovan, Spain), following by the addition of 3 ml of diethyl ether, shaken for another 20 minutes and then centrifuged at 3000 rpm 5 minutes. Organic layer was collected and evaporated under minimum flow rate of dry air of nitrogen. Dried residue was reconstituted in 500 μl diethyl ether. After being homogenized, the extracts were filtered using PTFE filter and transferred to the glass insert within the vial.
Investigated tablets were ground into powder. The buffer solution pH 10.18 was prepared by adding 8.4 g of NaHCO3 and 10.6 g Na2CO3 with 1000 ml of high purity water. One hundred milligrams of tablet powder was dissolved in 2 ml buffer and shaken for 25 minutes 220 rpm. 200 μl of n-heptane was added into the undiluted solution and shaken for another 25 minutes followed by filtration using nylon filter. In the end, 500 μl of nheptane was added to the filtrate and then shaken for another 25 minutes. Organic layer was collected and filtered using PTFE filter and transferred to the vial.
Amount of each extract was subjected to GC-MS analysis to obtain impurity profiles. Analysis of each method was carried out in three replicates.
Anion test: 10 mg of powdered tablet was dissolved in 1 ml of high purity water followed by filtration. The filtrate was treated with 3-4 drops of 1.7% AgNO3 solution, a few drops of dilute ammonia solution and nitric acid, sequentially [14].
MDMA content analysis: Reference standard of d,l- MDMA.HCl (Purity: 99,95%) was purchased from Lipomed, Switzerland. GC-FID quantitation of MDMA was performed based on 6-reference standard solutions of MDMA. HCl in methanol over the concentration range of 25-400 μg/ml. 10 mg of powdered tablet was dissolved in 50 ml methanol, performed in triplicates. Each solution was diluted to 100μg/ml for GC-FID injection.
Instrumentations
Chemical profiles analysis
UV absorption analysis: CAMAG Linomat V was employed to spray solution to the activated silica gel 60 F254 plates from Merck, Germany. Spots of MDMA were visualized under single wavelength scan mode at 254 nm using TLC Scanner from CAMAG, Switzerland.
IR measurement: Mid-IR measurements were carried out using nicolet iS5 FT-IR spectrometer fitted with iD5 ATR accessory (Thermo scientific, USA). IR spectra of samples and MDMA standard were recorded in the spectral region of 4000-400cm-1 at spectral resolution of 8 cm-1. Each spectrum was collected from 16 scans. Spectral data was obtained by OMNIC software 9 (Thermo scientific, USA).
Organic impurity analysis: Samples prepared from the extraction method with pH 10.80 were carried out on GC-MS (EI) Agilent 7890B-5977B MSD using HP-5 MS UI 30 x 0.25 mm x 0.25 μm. 1.0 μl of each extracts were injected according to the split less mode. Injector temperature was set on 280âÂðC. Helium was used as the carrier gas with the flow rate of 1 ml/minutes. Oven temperature program was set as follows: 50°C (1 min) as initial temperature with 5°C/minutes to 150°C (12 minutes), 15°C/ minutes to 300°C (10 minutes). The mass spectrometer was operated under scan mode with scan range of m/z 40-500. The temperature of MS source and MS quadrupole were set on 280°C and 150°C, respectively.
As for samples prepared from another extraction method with pH 10.18, GC-MS parameters used were under the same conditions, except for the oven temperature which set as follows: 50°C (1 minutes) as initial temperature with 10°C/ minutes to 150°C (5.5 minutes), 10°C/minutes to 280°C (10 minutes). Run time needed for each injection was 13.5 minutes shorter than parameter applied for pH 10.80.
MDMA content analysis
Analysis of MDMA content in the ecstasy tablets was performed by shimadzu GC-2010 with FID and AOC-5000 auto injector. 1 μl of 100 μg/ml samples in methanol were injected to GC-FID according to the split mode (50:1), the column was DB-5 (5% phenyl 95% dimethylpolysiloxane), 30 m x 0.25 mm ID x 0.25 μm. Separation was achieved using the following oven temperature program:135°C (2 minutes) as initial temperature with 15°C/minutes to 230°C. Flow rate was set on 1.2 ml/ minutes and the injector temperature was 280°C. Detector temperature was set at 300°C. Total run time for each analysis was 8.33 minutes.
Results and Discussion
Physical characterization
To begin our study, the ecstasy tablets were first physically investigated (Figure 2). Tablet identification is shown in Table 1. Color test using Marquis, Mandeline and Simon reagent produced black, black and deep blue color, respectively, indicated positive reaction to MDMA [14,15].

Figure 2: Dimension of tablets.
| Sample ID | Pink Versace |
|---|---|
| Color (solid/mottled) | Mottled |
| Logo | Appeared in both sides |
| Imprint description | Imprinted |
| Coating | Uncoated |
| Dimension (x,y,z) [mm] | (12.33 ± 0.0231), (5.51 ± 0.0115), (10.40 ± 0.1217) |
| Weight [mg] | 407.1 ± 8.5243 |
Table 1: Physical identification of the investigated tablets.
Chemical characterization
UV absorption analysis: HPLTC method coupled with UV detection was performed to identify compounds of the Pink Versace tablet and analyze the UV absorption of the sample. The bands for MDMA from standard and samples were confirmed by comparing the Rf max value (Figure 3) and UV spectrum at 254 nm under 200-400 nm wavelength (Figure 4) of each band.

Figure 3: HPTLC chromatogram of (a) reference standard of MDMA and the Pink Versace tablet extracted under (b) methanol and (c) diethyl ether in alkaline condition, pH 12.80.

Figure 4: UV spectra of standard (green color) and sample (red color) at 254 nm under 200-400 nm wavelength.
The major peaks in Figure 3a and 3b with Rf max value of 0.54 and 0.52, respectively, were peak for MDMA. Figure 3c revealed the presence of broadening peak of MDMA at Rf max value of 0.51 with tailing to Rf 0.66 and Rf 0.94. It might due the sample concentration was too high, since the sample extraction method under alkaline pH 12.80 was applied to chemical profile analysis using GC-MS where it required a high sample concentration to detect the organic impurities which were present at substantially lower levels. Overlaid UV spectra of standard and sample demonstrated the maximum wavelength for MDMA was 286 nm (Figure 5).

Figure 5: IR spectra of (a) MDMA standard (b) Pink Versace tablet obtained by the nicolet iS5 spectrometer in the spectral region of 1800-500 cm-1
IR measurement: ATR-FTIR was used to identify the functional group existents in the Pink Versace tablet. IR spectrum of sample was compared to the standard of MDMA. Fingerprint region below 1500 cm-1 was used for the identification of MDMA in the ecstasy tablet. Peaks obtained in the IR spectrum of the sample corresponded to the vibration of different functional groups [17]. Figure 5b shows the obtained bands at 1487 cm-1 (C-H bonding), 1246, 1188 and 1031 cm-1 (C-O-C stretching of methoxy group or aromatic methylenedioxy group), 927 cm-1 (CO stretching), and the region of 1441-1487 cm-1 (C=C stretching of aromatic ring), which were similar to the IR profile of MDMA standard (Figure 5a).
Organic impurity analysis: Both extraction methods were carried out under alkaline pH since (2005) have reported the efficiency of basic over the neutral conditions to extract the impurities of the tablets [7]. In this study, we did not make a comparison on which pH was more effective between two methods. It is supposed that two extraction methods could complement each other’s information on impurity profiles of ecstasy tablet analyzed. The organic impurity profiles of ecstasy tablets depend on synthetic route involved. Safrole is the main constituent of sassafras oil, derived from plants belongs to Lauraceae family. Safrole can be subsequently converted to isosafrole and piperonal [16]. 3,4-MDP2P, meanwhile, can be synthesized from 1) Safrole, by Wacker oxidation of safrole (using p-benzoquinone, PdCl2) or the isomerisation of safrole to isosafrole followed by per-acid oxidation and acid dehydration of isosafrole, and 2) piperonal, by nitroalkene derivate reduction with iron in hydrochloric acid [12,17,18].
Impurity profiles of Pink Versace ecstasy tablets were identified using GC-MS. In this study, a total of 24 and 22 impurities were detected from extraction methods under pH 12.80 and pH 10.80, respectively, see Table 2. Most of the identified impurities were also reported as previous study findings by [7,12,13,21]. Figure 6 shows typical GC-MS chromatograms obtained from each extraction method. Impurities identified under pH 12.80 and pH 10.18 extracts are presented in Table 2.
| Peak Identity | Structure | Name | EI Mass Spectral Data (m/z) |
|---|---|---|---|
| 1 a,b | 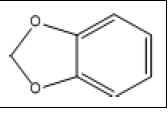 |
1,3-Benzodioxole | 121, 122, 63, 64, 193 |
| 2 a,b | 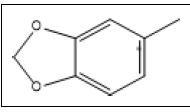 |
3,4-(Methylenedioxy)toluene | 135, 136, 77, 78, 51, 105 |
| 3 a,b | 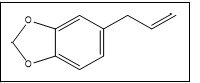 |
Safrole | 162, 104, 131, 77, 51 |
| 4 a,b | 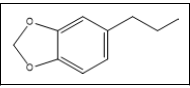 |
1-(3,4-methylenedioxyphenyl)propane | 135, 164, 77, 105, 51 |
| 5 a,b | 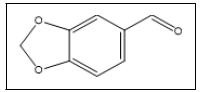 |
Piperonal | 149, 150, 121, 63, 91, 162 |
| 6 a,b | 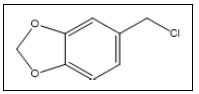 |
3,4-Methylenedioxybenzyl chloride / Piperonyl chloride | 135, 170, 77, 105, 150, 281 |
| 7 a,b | 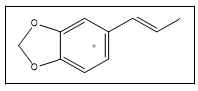 |
Isosafrole | 162, 104, 131, 77, 51 |
| 8 a,b | 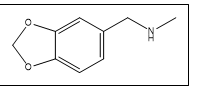 |
3,4-Methylenedioxy-N-methylbenzylamine | 135, 164, 165, 136, 77, 121 |
| 9 a,b | 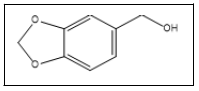 |
Piperonyl alcohol | 152, 135, 93, 65, 123 |
| 10 a,b | 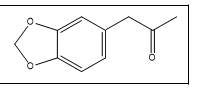 |
3,4-Methylenedioxyphenyl acetone / 3,4-MDP2P | 135, 178, 77, 51 |
| 11 a,b | 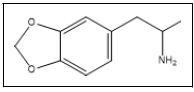 |
Tenamfetamina | 44, 136, 77, 106 |
| 12 b | 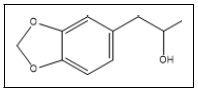 |
1-(3,4-Methylenedioxyphenyl)-2-propanol | 135, 136, 180, 77, 106 |
| 13 a | 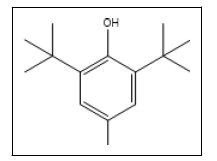 |
BHT | 205, 220, 145, 177, 57, 81 |
| 14 a,b | 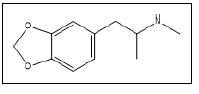 |
MDMA | 58, 135, 77, 105 |
| 15 a,b | 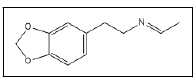 |
3,4-methylenedioxyphenethylamine ethyl imine | 56, 191, 135, 77, 160 |
| 16 a,b | 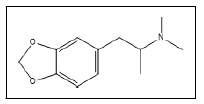 |
N,N Dimethyl-3,4-methylenedioxyamphetamine | 72, 135, 44, 77, 95, 105 |
| 17 a,b | 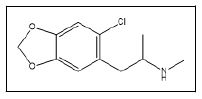 |
Cl-MDMA | 58, 169, 111, 75 |
| 18 a,b | 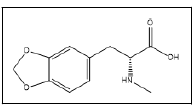 |
N-methyl-3,4-methylenedioxyphenylalanine | 88, 178, 135, 197 |
| 19 a | 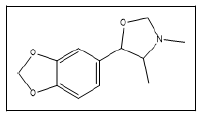 |
3,4-dimethyl-5-(3,4-methylenedioxy)phenyloxazolidine | 71, 189, 57, 121 |
| 20 a | 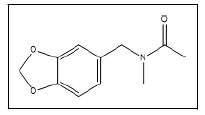 |
N-methyl-N-acetyl-3,4-methylenedioxybenzylamine | 135, 207, 150, 164 |
| 21 a,b | 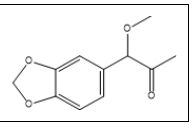 |
1-(3,4-methylenedioxyphenyl)-1-methoxypropan-2-one | 165, 124, 55, 150, 97 |
| 22 a,b | 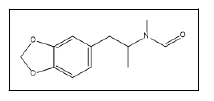 |
N-Formyl-N-methyl-3,4-methylenedioxyamphetamine | 162, 86, 58, 135 |
| 23 a,b | 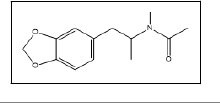 |
N-Acetyl-3,4-methylenedioxymethamphetamine | 162, 58, 105, 122, 135 |
| 24 a,b | 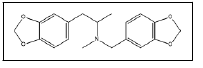 |
MD benzyl MDMA | 135, 192, 77, 161 |
| 25 a,b | 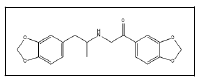 |
3,4-Methylenedioxybenzoyl-3,4-methylenedioxymethamphetamine | 149, 206, 162, 121, 97 |
a=Impurities found under pH 12.80 extracts
b=Impurities found under pH 10.18 extracts
Table 2: Tabulated impurities encountered in Pink Versace tablets.

Figure 6: GC-MS chromatograms of Pink Versace tablets obtained from the extraction methods under (a) pH 12.80 (b) pH 10.18 Peak
In this study, safrole 3 and isosafrole 7 were indistinguishable by the instrument system. Safrole was detected in two different retention times. However, we determined peak 7 as isosafrole based on the similarity of retention time reported and the abundance of ion fragment provided [13]. The overlapping peaks occurred at Rt 21.35 minutes-22.28 minutes and Rt 13.98-14.84 minutes for pH 12.8 and pH 10.18, respectively. Further analysis using Automated Mass Spectral Deconvolution and Identification System (AMDIS) software was carried out to deconvolute the raw GC-MS data file to find the separate components in the overlapping peaks. AMDIS extracted the mass spectra of the individual peak followed by identification of ions from the extracted spectrum resulting from the deconvolution process using NIST mass spectral library. Analysis by AMDIS confirmed two peaks involved: 3,4- Methylenedioxyphenyl acetone/3,4-MDP2P 10 and Tenamfetamina 11 in both overlapping peaks. Figure 7 shows an expanded chromatogram and major characteristic ions of the deconvoluted compounds over the retention time which was obtained from extraction under pH 10.18. Significant peaks could be easily seen, by m/z 135 (base peak of 10) and m/z 44 (base peak of 11), detected as 3,4-MDP2P in times of (a1) 14.082 minutes and (a2) 14.708 minutes and Tenamfetamina in time of (b) 14.349 minutes. Mass spectral displays obtained are given in Figure 8.

Figure 7: Expanded chromatogram and major characteristic ions of the deconvoluted compounds obtained from extraction under pH 10.18 (blue line for m/z 135; red line for m/z 44).

Figure 8: Mass spectral displays of (a,c) 3,4-MDP2P and (b) Tenamfetamina : Raw spectrum overlaid with the extracted spectrum resulting from the deconvolution process.
In this study, 3,4-MDP2P was plausible to be the key intermediate, not the main precursor, due to the presence of impurities 3,7 and piperonal 5. This findings posed challenges to determine the main precursor used in the manufacturing process of the investigated tablets. The intermediate 10, in this case, was probably obtained from 7, while 5 is the result of isosafrole oxidation which will undergo nitroalkene derivate reduction to produce 10. Unfortunately, specific impurities of this route, 1-(3,4-methylenedioxyphenyl)-2-propanone oxime was not detected, it might be due to its low amount. Other impurities namely 1,3-Benzodioxole 1 and 3,4- (Methylenedioxy)toluene 2 were found in the investigated tablets and those were reported to be found in MDMA samples synthesized from sassafras oil [12]. Furthermore, 7 was presumably being the result of isomerization of 3. Reduction of safrole or isosafrole yielded 1-(3,4- methylenedioxyphenyl)propane 4 as by-product [12]. Afterwards, based on the impurities found, we guess that the main precursor used in the synthesis of investigated tablets was safrole. The source of safrole could not be determined since the use of several uncontrolled pre-precursor (e.g. eugenol, cathecol) was reported instead of extraction of sassafras oil. Impurities 1 was also detected in the synthesis 3,4-MDP2P from both pre-precursors [19].
Subsequently, we looked forward to other impurities encountered in the investigated tablets to determine the synthesis route involved. Peak 15 identified as 3,4- methylenedioxyphenethylamine ethyl imine was found with ± 70% library match. Based on its chemical structure, it was known to have the same molecular weight and major mass spectral fragment ion with 1,2-(Methylenedioxy)-4-(2-N-methyliminopropyl) benzene (Figure 9), which was reported as the specific impurity of the reductive amination of 3,4-MDP2P [12]. In this case, the synthesis route involved was presumably reductive amination. This assumption was strengthened by other organic impurity found as 3,4-MDP2P corresponding reductive form, namely 1-(3,4-Methylenedioxyphenyl)-2- propanol 12. Hereafter, other impurities found were 3,4- Methylenedioxy-N-methylbenzylamine 8 and piperonyl alcohol 9, previoulsy reported as side product of reductive amination of piperonal using methylamine and reduction of piperonal, respectively [12,13]. The presence of those impurities in samples might indicate that MDMA was synthesized by reductive amination of 3,4-MDP2P that derived from piperonal. Two different routes to produce 3,4-MDP2P from piperonal has been reported [20]. Moreover, the co-existence of 8 and 12 together implies that 3,4-MDP2P was derived from piperonal that undergone nitroalkene derivate reduction [4].

Figure 9: Structure similarity of 3,4- methylenedioxyphenethylamine ethyl imine (a) and 1,2-(Methylenedioxy)-4-(2-N-methyl-iminopropyl)benzene (b), MW 191, Mass spectral fragment ion of m/z 56, 191, 135, 77, 160.
The detail impurities obtained from reductive amination of 3,4-MDP2P using three different reducing agents: Aluminiummercury amalgam (Al/Hg), sodium borohydrate (NaBH4) or sodium cyanoborohydrate (NaBH3CN). In their study, 12 was only identified in MDMA synthesized by reductive amination with NaBH4 as reducing agent preceded by 3,4-MDP2P synthesis from piperonal. However, we could not exactly determine the reducing agent used in the reductive amination process since we found impurity 1-(3,4-methylenedioxyphenyl)-1- methoxypropan-2-one 21. This impurity was reported to be found as by-product obtained from other reducing agent, NaBH3CN. In fact, it would be difficult to determine the reducing agent used in the reductive amination process as reported, where the impurities found in the samples synthesized from three different reduction methods were indistinguishable.
The investigated tablets contained synthesis by-products as follows : Cl-MDMA 17, 3,4-dimethyl-5-(3,4-methylenedioxy) phenyloxazolidine 19, N-Formyl-N-methyl-3,4 methylenedioxyamphetamine 22 and N-Acetyl-3,4- methylenedioxymethamphetamine 23 which were previously reported as impurities found in the reductive amination route [21]. MDbenzylMDMA 24 was unspecifically reported as sidereaction occurring in MDMA synthesis since it encountered in the samples synthesized by both Leuckart and reductive amination route [7]. Other impurities identified were Nmethyl- 3,4 methylenedioxyphenylalanine 18 and 3,4- Methylenedioxy-3,4 methylenedioxymethamphetamine 25. Those were not reported in any previous publications. Proposed scheme of Pink Versace tablets production shown in Figure 10.

Figure 10: Proposed scheme of Pink Versace tablets production.
Each extraction method was brought out in three replicates to make sure whether the same result was always obtained. Our study showed that each of impurities could be identified in each replication. Therefore, the methods applied were able to be used in the future studies to more ecstasy samples profiled and enable others to repeat the methodology.
Anion test: Anion test was performed to the investigated samples according to the UNODC guidance prior to MDMA content analysis. Samples dissolved in water needed to be filtered since not all the diluents/excipients were soluble in water, yet the MDMA was very soluble in water [14]. By adding 1.7% AgNO3 solution to the filtrate, a white curdy precipitate was formed, initially indicated that anion contained in tablet was chloride. Additional test using ammonium hydroxide dissolved the precipitate and it was re-precipitated by the addition of nitric acid. It was clearly understood that the active substance of the investigated tablet was MDMA hydrochloride.
MDMA content analysis: MDMA content analysis in the ecstasy tablets was carried out using GC-FID. The percentage of MDMA hydrochloride in each tablet was calculated using the following equation:
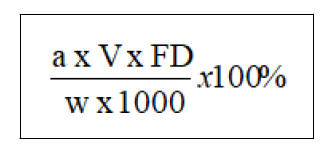
In which a is peak area of MDMA, V is final volume of sample preparation (ml), FD stands for factor dilution and w is weight of powdered tablet in mg.
In this study, the average percentage of MDMA hydrochloride content in Pink Versace tablets was 43.25% (equivalent to amount of MDMA hydrochloride 180.35 mg).
Conclusion
The combination data of the physical and chemical characteristics of the ecstasy tablets are very important to build the database of the ecstasy tablet profiles seized in the country. Our recent study demonstrated this objective. The Pink Versace ecstasy tablets seized in Indonesia were simultaneously physical and chemical investigated.
The tablets were found to contain MDMA as single active ingredient, the MDMA hydrochloride content was 180.35 mg from the tablet weight of 417 mg. Several impurities found along with MDMA were noted as plausible precursors used in the illicit production process. However, based on our interpretation, safrole was the main precursor used in the synthesis of Pink Versace tablets yielded 3,4-MDP2P as key intermediate. The ecstasy tablets were then synthesized by reductive amination of 3,4-MDP2P.
There were only slight difference results from the two extraction methods used in this study, where each method showed good reproducibility. Some impurities were only detected in one method, and vice versa. Therefore, both methods can complement each other in representing the impurity profiles and simplify data interpretation to predict the synthetic route of the tablet production.
MDMA profiling provides source of information about the physical characteristics, synthetic production method and potential precursor used of the ecstasy tablet that will be very useful for precursor monitoring and finding out the trafficking of ecstasy tablets worldwide. Further work with larger sample sizes is required to classify and link between seizures.
Acknowledgements
The authors gratefully acknowledge Mr. Wahyu Widodo, the Head of Drugs Testing Laboratory of National Narcotics Board (BNN) Republic of Indonesia and Mr. Kuswardani Soedigdo, the Head of Laboratory Testing and Service Division of Drugs Testing Laboratory of National Narcotics Board (BNN) Republic of Indonesia for the support and valuable advice during the research. Authors also appreciate the national narcotics board of south sumatera province for submitting ecstasy samples to our Laboratory.
References
- Badan narkotika nasional (2021) Indonesia drugs report 2021. Pusat penelitian, Data, dan informasi badan narkotika nasional, Jakarta.
- Badan narkotika nasional (2022) Indonesia drugs report 2022. Pusat penelitian, Data, dan informasi badan narkotika nasional, Jakarta.
- Baer I (2007) The analysis of excipients in ecstasy tablets and their contribution in a drug profiling context. Theses de doctorat 2: 216.
[Crossref], [Google Scholar]
- Cheng WC, Poon NL, Chan MF (2003) Chemical profiling of 3, 4-methylenedioxymethamphetamine (MDMA) tablets seized in Hong Kong. J Forensic Sci 48: 1249-1259.
[Crossref], [Google Scholar], [Indexed]
- Wood DM, Stribley V, Dargan PI, Davies S, Holt DW, et al. (2011) Variability in the 3, 4-methylenedioxymethamphetamine content of ‘ecstasy’tablets in the UK. Emerg Med J 28: 764-765.
[Crossref], [Google Scholar], [Indexed]
- Couchman L, Frinculescu A, Sobreira C, Shine T, Ramsey J, et al. (2019) Variability in content and dissolution profiles of MDMA tablets collected in the UK between 2001 and 2018–A potential risk to users?. Drug Test Anal 11: 1172-1182.
[Crossref], [Google Scholar], [Indexed]
- Swist M, Wilamowski J, Parczewski A (2005) Basic and neutral route specific impurities in MDMA prepared by different synthesis methods: Comparison of impurity profiles. Forensic Sci Int 155: 100-111.
[Crossref], [Google Scholar], [Indexed]
- UNODC (2014) Global synthetic drugs assessment: Amphetamine-type sti mulants and new psychoacti ve substances. United Nations, New York.
- https://www.emcdda.europa.eu/publications/drug-profiles/mdma_en
- Chambers SA, DeSousa JM, Huseman ED, Townsend SD (2018) The dark side of total synthesis: strategies and tactics in psychoactive drug production. ACS Chem Neurosci 9: 2307-2330.
[Crossref], [Google Scholar]
- Weyermann C, Marquis R, Delaporte C, Esseiva P, Lock E, et al. (2008) Drug intelligence based on MDMA tablets data: I. organic impurities profiling. Forensic science international 177: 11-16.
[Crossref], [Google Scholar], [Indexed]
- Gimeno P, Besacier F, Bottex M, Dujourdy L, Chaudron-Thozet H (2005) A study of impurities in intermediates and 3, 4-methylenedioxymethamphetamine (MDMA) samples produced via reductive amination routes. Forensic Sci Int 155: 141-157.
[Crossref], [Google Scholar], [Indexed]
- Gimeno P, Besacier F, Thozet CH, Girard J, Lamotte A (2002) A contribution to the chemical profiling of 3,4-methylenedioxymethamphetamine (MDMA) tablets. Forensic Science International 127: 1-44.
[Crossref], [Google Scholar], [Indexed]
- Camag® (2018) Application Note: Screening method for identification of forensic drugs.
- UNODC (2006) Recommended methods for the identification and analysis of amphetamine, methamphetamine and their ring-substituted analogues in seized materials. United Nations Publication, New York.
- UNODC (2009) Screening colour test and specific colour tests for the detection of methylendioxyamphetamine and amphetamine type stimulants: Scientific and technical Notes. Laboratory and scientific section, Division of policy analysis.
- Fagan P, Spalovska D, Kuchar M, Cernohorsky T, Komorousova L, et al. (2021) Ecstasy tablets: Rapid identification and determination of enantiomeric excess of MDMA. Forensic Chem 26: 100381.
[Crossref], [Google Scholar]
- Lima LM (2015) Safrole and the versatility of a natural biophore. Rev Virtual Quim 7: 495-538.
[Crossref], [Google Scholar]
- Nair JB, Hakes L, Klosinski BY, Paisner K (2021) Fully validated, Multi-kilogram cGMP synthesis of MDMA. ACS omega 7: 900-907.
[Crossref], [Google Scholar], [Indexed]
- Heather E, Shimmon R, McDonagh AM (2015) Organic impurity profiling of 3,4-methylenedioxymethamphetamine (MDMA) synthesised from catechol. Forensic Sci Int 248: 140-147.
[Crossref], [Google Scholar], [Indexed]
- Swist M, Wilamowski J, Parczewski A (2005) Determination of synthesis method of ecstasy based on the basic impurities. Forensic Sci Int 152: 175-184.
[Crossref], [Google Scholar], [Indexed]
- Heather EN (2020) The synthesis and chemical profiling of 3,4-Methylene-dioxymethamphetamine (MDMA) and analogues.
- Dal CTA (1990) An evaluation of the potential for clandestine manufacture of 3, 4-methylenedioxyamphetamine (MDA) analogs and homologs. J Forensic Sci 35: 675-697.
[Crossref], [Google Scholar]
- Plummer CM, Breadon TW, Pearson JR, Jones OA (2016) The synthesis and characterisation of MDMA derived from a catalytic oxidation of material isolated from black pepper reveals potential route specific impurities. Sci Justice 56: 223-230.
[Crossref], [Google Scholar]
Open Access Journals
- Aquaculture & Veterinary Science
- Chemistry & Chemical Sciences
- Clinical Sciences
- Engineering
- General Science
- Genetics & Molecular Biology
- Health Care & Nursing
- Immunology & Microbiology
- Materials Science
- Mathematics & Physics
- Medical Sciences
- Neurology & Psychiatry
- Oncology & Cancer Science
- Pharmaceutical Sciences