Utilization of GC-MS and GC-FID to Build a Database of Ecstasy Tablet Profiles in Indonesia
Tanti Tanti
Center of Drugs Testing Laboratory of National Narcotics Board (BNN) of the Republic of Indonesia, Bogor, Indonesia
Published Date: 2023-12-12DOI10.36648/2472-1123.9.4.61
Tanti Tanti*, Carolina Tonggo Marisi Tambunan, Maimunah, Christien Andriyani Lalangi, Erlana Nindya Maulida, Widianti Ningtias, Dwi Asmayanti, Martin Luther Silubun, Diani Mardhatillah and Sri Lestari
Center of Drugs Testing Laboratory of National Narcotics Board (BNN) of the Republic of Indonesia, Bogor, Indonesia
- *Corresponding Author:
- Tanti Tanti
Center of Drugs Testing Laboratory of National Narcotics Board (BNN) of the Republic of Indonesia, Bogor,
Indonesia
E-mail: tanti.puslabbnn@gmail.com
Received date: November 11, 2023, Manuscript No. IPJOIC-23-18133; Editor assigned date: November 14, 2023, PreQC No. IPJOIC-23-18133 (PQ); Reviewed date: November 28, 2023, QC No. IPJOIC-23-18133; Revised date: December 05, 2023, Manuscript No. IPJOIC-23-18133 (R); Published date: December 12, 2023, DOI: 10.36648/2472-1123.9.4.61
Citation: Tanti T, Tambunan CTM, Maimunah, Lalangi CA, Maulida EN, et al. (2023) Utilization of GC-MS and GCFID to Build a Database of Ecstasy Tablet Profiles in Indonesia. J Org Inorg Chem Vol:9 No.4:61.
Abstract
Objective: This paper reports identification of physical characteristics, qualitative and quantitative analysis of ecstasy tablets seized in Indonesia during period of February to September 2023 which will be utilized to build a database of ecstasy tablet profiles.
Methods: The physical examination consist of photographic documentation to the front and back side of each seized tablet followed by visual inspection to determine shapes, colors, logos or marking imprint, dimension and weight. Liquid-liquid extraction was carried out on each tablet prior to qualitative analysis using Gas Chromatography-Mass Spectrometry (GC-MS) to identify the tablet composition. Henceforward, identification of the predominantly type of salt involved in the ecstasy tablets was performed by anion test and IR spectroscopy. For further investigation, quantitative analysis using Gas Chromatography-Flame Ionization Detector (GC-FID) was utilized to measure the MDMA content in the ecstasy tablets profiled.
Results: In this study, a total of 24 ecstasy tablets seized during period of February to September 2023 were examined. The analyzed samples mainly found to contain MDMA as single active drug. All samples were presumably distributed in the form of hydrochloride salt. The average weight and MDMA hydrochloride content of seized ecstasy tablets were 350.42 mg and 145.76 mg, respectively.
Conclusion: The data derived from the physical examination, qualitative and quantitative analysis could initiate building the database of ecstasy tablet profile seized in Indonesia.
Keywords
Ecstasy; MDMA; Tablet composition; MDMA content; Ecstasy profile; GC-MS; GC-FID; Indonesia
Introduction
The developments of chemical and related equipment, as well as the improvement of manufacturing technique have contributed to the synthetic drugs phenomenon worldwide [1]. 3,4-Methylendioxymethamphetamine (MDMA), commonly known as ecstasy, is a synthetic drug belongs to amphetaminetype stimulant which remain being global attention. MDMA is classified as schedule I Narcotic under the drugs law in Indonesia, defined as substances with highly addictive, high potential for abuse and restricted for therapeutic purpose. MDMA affects the levels of the neurotransmitters in the brain specifically Norepinephrine (NE), Serotonin (SER) and Dopamine (DA) [2-5], causing stimulant and emphatogenic/entactogenic effects which potentially lead to hallucinogenic effect at higher doses [6].
Ecstasy is predominantly found in tablet form which is taken orally [7]. Its use is associated to the night club setting or Electronic Dance Music (EDM) parties [8]. The drug users of ecstasy-type substances reached an estimated 20 million people in 2021, representing 0.4 percent of the global adult population [9]. It was reported that people consume ecstasy in night parties for enhancing enjoyment of experiences around the large crowd and loud electronic music, producing an energizing effect that can be promoting euphoria, feelings of closeness, empathy and sexuality [7,8].
The quantity of ecstasy tablets seized in the East and Southeast Asia region showed a large increase in 2022, to more than 6.7 million tablets compared with 3.7 million tablets in the previous year [10]. Along with that, data released by National Narcotics Board shows an approximately 85% percent increase of seizures of ecstasy tablets in Indonesia, from 0.872 million in 2021 to 1.609 million in 2022 [11,12].
Ecstasy tablets seized in illicit market vary in shapes, colors and weight that develop over time. The issue is more complicated due the variety of drugs composition that can be harmful for the abusers [7]. Based on the data of our laboratory, ecstasy could be found to contain MDMA as single active drug or along with caffeine or ketamine as adulterants. Other substances belong to amphetamine type stimulants e.g. amphetamine and methamphetamine or New Psychoactive Substances (NPS) e.g. Eutylone, N-ethylpentylone, 4-CEC, 3-CMC and Polymethyl Methacrylate (PMMA) were sometimes added to the recipe to produce multi compound tablets. The emergence of ecstasy tablet containing no MDMA and replacing by NPS as active drug with or without adulterants is a new attention [13].
MDMA is typically encountered as hydrochloride or phosphate salt [14]. MDMA content in ecstasy tablets has been reported to increase. As published in 2011 by [15], the average amount of MDMA hydrochloride in ecstasy tablet seized in UK was 58.7 ± 22.9 mg per tablet, increased to 125 mg MDMA hydrochloride per tablet in 2018 [16] and between 148-173 mg of MDMA per tablet in 2021 in Europe [17]. However, the measurement of MDMA content has not been performed to the ecstasy tablets seized in Indonesia.
The increasing number of seizures, users and MDMA content, as well as the variety of mixture or composition of ecstasy tablets has become a challenge for drugs testing laboratories to continuously update the profiles of seized ecstasy tablets. Several studies have reported qualitative and/or quantitative analysis of MDMA in ecstasy tablets using various types of analytical instruments [18-22]. In this study, we documented the physical characterization and identified the composition of ecstasy tablets using Gas Chromatography-Mass Spectrometry (GC-MS). Analytical method using Infrared (IR) spectroscopy was applied as a complementary analysis to anion test to determine the type of salts involved in the samples. Further analysis employed Gas Chromatography-Flame Ionization Detector (GC-FID) to measure the MDMA content in the ecstasy tablets. By this research, we would like to find out the correlation about tablet composition to the content of MDMA in each investigated tablet. The data derived from this study are supposed to be a database of ecstasy profiles seized in Indonesia. Since the main source of ecstasy tablets in Indonesia comes from smuggling cases, not disclosures of clandestine laboratories, the data could hopefully become beneficial information to other laboratories for similar cases and for intelligence purpose.
Materials and Methods
Materials
Reference standard of d,l-MDMA.HCl (purity: 99.95%) was purchased from lipomed, Switzerland. Methanol (hypergrade for LC-MS), ammonia solution 25% (for analysis), nitric acid 65% (for analysis) and silver nitrate (for analysis). Extraction solvent consist of dichloromethane (for analysis), dichloroethane (for analysis), n-heptane (for liquid-chromatography), sodium chloride (for analysis) and sodium sulfate (for analysis) were prepared inhouse. All chemicals and reagents were purchased from Merck, Germany. High purity water (18.2 M ohm) was treated by Arium® water purification system (Sartorius, Germany). Lactose, Avicel pH-101 and Sodium Carboxymethyl Cellulose (CMC-Na) were purchased in a market place.
Samples
A total of 26 ecstasy tablets were collected from the police or investigator seizures that submitted to the Center of Drugs Testing Laboratory of BNN during the period of February to September 2023. All samples were initially directed to the physical characterization including shape, color, logo, size and weight prior to homogenization for further analysis.
Preliminary identification using color test was performed after samples were ground into powder. A qualitative analysis was undertaken by GC-MS. Each of samples in a whole tablet were kept in airtight vials and stored at refrigerator (5°C to 6°C) until the end of collecting period then subjected to a quantitative analysis using GC-FID. An anion test was additionally performed to identify the type of salt involved in the samples followed by IR measurement to confirm the result of anion test.
Instrumentation
Qualitative analysis was carried out on GC-MS (EI) Agilent 7890B-5977B MSD. 0.5 μl of each extracted sample was injected according to the split mode (50:1), the column was HP-5 MS UI 30 m × 0.250 mm × 0.25 μm. Separation was achieved using the following oven temperature program: 100°C (2 min) as initial temperature with 10°C/min to 280°C (4 min). Flow rate was 1 ml/ min. The injector and ion source temperature were set on 250°C and 280°C, respectively. The GC-MS method has been validated for MDMA identification.
Shimadzu GC-2010 with FID and AOC-5000 auto injector was utilized for MDMA content analysis. 1.0 μl of 100 μg/ ml samples in methanol were injected to GC-FID according to the split mode (50:1), the column was DB-5 (5% phenyl 95% dimethylpolysiloxane), 30 m x 0.25 mm ID x 0.25 μm. The oven temperature was set as follows:135°C (2 min) as initial temperature followed by 15°C/min to 230°C with the flow rate of 1.2 ml/min. The injector and detector temperature was 280°C and 300°C, respectively. Total run time of each analysis was 8.33 min. The GC-FID method has been validated for MDMA identification.
Sample preparation
Qualitative analysis: A total of 80 mg of each sample was weight and dissolved in 5 ml of water then vortexed for 5 min. Extraction solvents were prepared in another test tube followed by addition of NaOH 0.1N. 3 ml of sample solution was added into each of extraction solvents. The extraction was applied to the sample for 5 min followed by centrifugation under 3000 rpm for 5 min. Organic layer was transferred to the syringe with PTFE filter to filtration step prior to GC-MS analysis.
For IR measurement, a small amount of the homogeneous powdered of samples and standard were directly put on the ATR crystal until the crystal completely covered by the powder. A background check was applied as initial measurement to subtract any undesirable residual peaks. After each measurement of samples, the ATR crystal was cleaned using a smooth tissue paper moistened with ethanol and allowed to dry in room temperature prior to the next analysis.
MDMA content analysis: A simply extraction technique using methanol was applied in this study. 2 mg of each powdered tablet was weight out and dissolved in 10 ml methanol, performed in triplicates. The samples were vortexed followed by centrifugation under 3000 rpm for 5 min. 2 ml of each extracted sample was filtered using PTFE filter prior to GC-FID injection.
Anion test: 10 mg of each powdered tablet was dissolved in 1.0 ml of high purity water followed by filtration to eliminate the residue. The filtrate was dripped with 3-4 drops of AgNO3 solution, a few drops of dilute ammonia solution and nitric acid, sequentially [23].
As a complimentary analysis, Mid-IR measurements were carried out using Nicolet summit X FT-IR spectrometer fitted with Everest ATR accessory (Thermo Scientific, USA). IR spectra of MDMA standard and samples were recorded in the spectral region of 4000-400 cm-1 at spectral resolution of 4 cm-1. Each spectrum was collected from 16 scans. OMNIC paradigm software (Thermo Scientific, USA) was applied to provide the spectral data.
Standard preparation
The calibration curve was constructed over the UNODC guidance [23]. A standard stock solution containing 0.4 mg/ml of d,l- MDMA.HCl in methanol was diluted to 5-reference standard solutions over the concentration range of 10-200 μg/ml for quantitation of MDMA. Each one was performed in triplicate. The standard solutions were injected to GC-FID in the same day of its preparation.
Results and Discussion
Physical examination
A total of 26 various types of ecstasy tablets from the disclosure of 12 narcotic cases were stored during the sample collection period. As the result of visual inspection, two samples were classified as outlier because they were did not represent the whole tablet as required. Shapes, colors, logos, dimension and weight of individual tablet were determined after photographic documentation.
Qualitative analysis
After well documented, all samples were ground to powder prior to further analysis. A color test using Marquise, Mandeline and Simon reagents yielded black, black and blue color, respectively. It indicated the presence of MDMA in all samples [23,24]. Henceforward, a confirmation test using GC-MS was carried out to the samples to identify the composition of each ecstasy tablet.
Quantitative analysis
To begin of our quantitative analysis, the type of salt of each ecstasy tablet was determined through anion test according to the UNODC guidance [23]. A little amount of each powdered sample was dissolved in water following by filtration to obtain clear solution containing MDMA and removed the residue that could interfere with the result.
By adding 1% AgNO3 solution to the filtrate, a white curdy precipitate was formed in all analyzed samples right after the addition of AgNO3. For three samples in code of 1, 13 and 15, the white curdy precipitation was quickly changed to cream one. Additional test using ammonium hydroxide and nitric acid was performed to 21 samples in white curdy precipitation and showed the result as follows: White curdy precipitate dissolved in ammonium hydroxide and re-precipitated by the addition of nitric acid. It clearly indicated that the chloride salt was involved in 21 samples. Since the predominantly type of MDMA salt distributed worldwide were chloride and phosphate, we took an assumption to phosphate salt to samples 1, 13, 15. Further analysis using ammonium hydroxide and cold nitric acid was conducted to identify the type of salt involved. However, specific types of salt could not be determined.
To confirm the type of salt involved in all samples, the ATR-FTIR was used to identify the functional group existents in 24 investigated samples, then compared to spectra of MDMA hydrochloride working standard (Figure 1) that purified in house-laboratory from ecstasy tablets previously. 20 samples showed very similar IR spectra profiles (Figure 2a), one sample in code 4 showed a little bit difference from 20 others by missing peak in the region of 3200 cm-1 (Figure 2b). Three samples in code of 1, 13 and 15 obtained the similar IR spectra to each other yet different from 21 samples (Figure 2c). Figures 2a-2c shows the characteristic bands present in the spectrum at 1487 cm-1 correspond to C-H bending, bands at 1246, 1188 and 1031 cm-1 to C-O-C stretching of methoxy group or aromatic methylenedioxy group, bands at 927 cm-1 to C-O stretching, and bands in the region of 1441-1487 cm-1 to C=C stretching of aromatic ring. When compared to IR spectra of MDMA hydrochloride standard, the fingerprint region below 1500 cm-1 of all samples were shown the similar characteristic peak to MDMA hydrochloride standard. It led to the assumption that the type of salt in all samples was hydrochloride. According to the published study by [25], IR measurement of di-Sodium hydrogen phosphate was performed to identify possibility of the presence of phosphate salt in samples 1, 13 and 15. Figures 3a and 3b shows the differences in peak patterns specifically in the fingerprint region between di-Sodium hydrogen phosphate and the investigated samples which were clearly different. This strengthens the assumption that chloride salts were present in samples 1, 13 and 15. In this study, it could not be determined the source of cream to brown color of precipitation as anion test result in three samples that did not meet the criteria of neither hydrochloride nor phosphate salt. However, the IR spectra pointed samples 1, 13 and 15 to the form of chloride salt.

Figure 1: IR spectra of MDMA hydrochloride standard.

Figure 2: Overlayed IR spectra of MDMA hydrochloride standard and samples. A: Code 2,3,5-12,14,16-20; B: Code 4; C: Code 1,13,15.

Figure 3: IR spectra of A: di-Na hydrogen phosphate; B: Overlayed samples 1,13,15.
The difference profile of IR samples spectra and standard of MDMA hydrochloride outside the fingerprint region in Figure 2a may due the composition of ecstasy tablet which consist of active drug(s) and many excipients such as diluents, binders, lubricants, disintegrators and dyes [26]. Each component of tablets will have contribution to an overall IR profile. In this study, the characteristic peaks in the IR spectra of several tablet excipients that often dismantled in clandestine laboratory i.e. lactose, Avicel pH-101, Sodium Carboxymethyl Cellulose (CMC-Na) were observed (Figure 4) and compared to the samples. The presence of O-H stretching of those excipients was confirmed by peaks at 3200 cm-1 [27]. Consequently, we suggested that the peaks at 3200 cm-1 detected in IR spectra of 20 samples might due the addition of one or more of those excipients or other excipients containing O-H group to the recipe of ecstasy tablet during the tableting process. Other samples in code of 1,4,13 and 15 were plausible to be manufactured with different excipients that did not contain any O-H groups.

Figure 4: IR spectra of A: Lactose; B: Avicel pH-101; C: CMC-Na.
The calibration curve was linear (r=1.000) over the concentration range of 10-200 μg/ml of d,l-MDMA.HCl. Peak of MDMA was detected at a retention time of 6 minutes. The regression line was used to plot the area of each sample that generated by GCFID. The MDMA content expressed as MDMA hydrochloride was calculated by the following equation:

In which a is area of MDMA generated by GC-FID, V is volume of sample preparation (ml), FD stands for factor dilution and w is weight of individual sample in mg.
The physical characterization, GC-MS analysis result and MDMA content of each investigated sample were summarized in Table 1.
| Code | Tablet appearance (front side and back side) |
Color | Logo or Marking imprint | Dimension: length × height × thickness (mm) | Weight (mg) | Tablet composition (% sum area by GC-MS)* | MDMA content measured by GC-FID (mg)** |
|---|---|---|---|---|---|---|---|
| 1 | 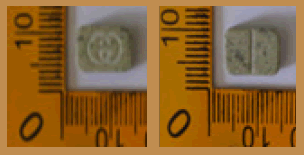 |
Green | Logo Gucci on one side | 11.55 × 7.55 × 4.35 | 388.2 | MDMA (43.28%), Caffeine (45.33%) | 159.24 |
| 2 | 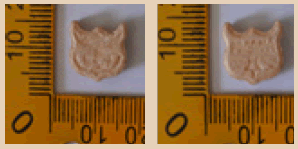 |
Beige | Logo Owl head on one side and marked ‘PANAMA’ on another side | 12.65 × 11.45 × 4.55 | 495.8 | MDMA (46.46%), PMMA (2.90%), Amphetamine (0.78%), Ketamin (42.01%) | 179.86 |
| 3 | 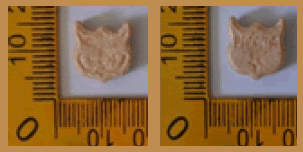 |
Beige | Logo Owl head on one side and marked ‘PANAMA’ on another side | 12.75 × 11.55 × 4.50 | 490.9 | MDMA (45.44%), PMMA (2.92%), Amphetamine (0.43%), Ketamin (46.32%) | 159.16 |
| 4 | 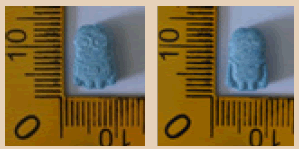 |
Blue | Logo minion on both sides | 7.80 × 11.40 × 5.55 | 350.36 | MDMA (83.60%), Theophylline (5.59%) | 216.78 |
| 5a,b*** | 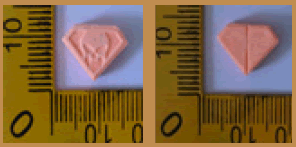 |
Orange | Logo Skull on one side | 13.85 × 9.55 × 4.00 | 320 | MDMA | 130.62-149.31 |
| 6a,b,c*** |  |
Light green | Logo Skull on one side | 13.80 × 9.45 × 4.15 | 327.8 | MDMA | 144.30-153.84 |
| 7a,b*** | 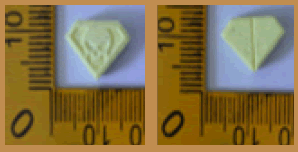 |
Yellow | Logo Skull on one side | 13.80 × 9.45 × 4.20 | 331.6 | MDMA | 129.09-154.39 |
| 8 | 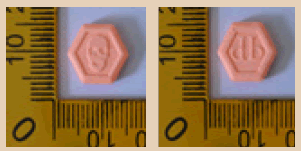 |
Orange | Logo Skull on one side and marked ‘db’ on another side | 12.50 × 11.25 × 3.30 | 309.8 | MDMA | 136.03 |
| 9 | 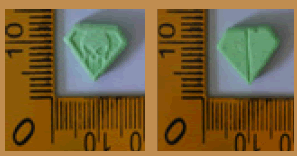 |
Green | Logo Skull on one side | 13.95 × 9.50 × 4.20 | 320 | MDMA | 130.66 |
| 10 | 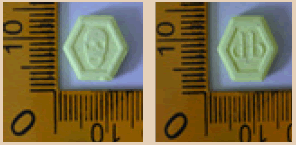 |
Light green | Logo Skull on one side and marked ‘db’ on another side | 12.65 × 11.20 × 3.40 | 337 | MDMA | 102.38 |
| 11 |  |
Pink | Logo Skull on one side and marked ‘db’ on another side | 12.60 × 11.35 × 3.55 | 315.2 | MDMA | 138.44 |
| 12 | 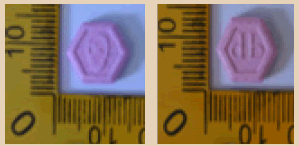 |
Purple | Logo Skull on one side and marked ‘db’ on another side | 12.50 × 11.20 × 3.30 | 310.4 | MDMA | 128.01 |
| 13 | 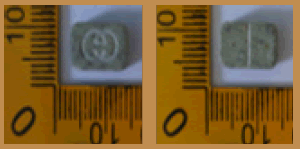 |
Dark green | Logo Gucci on one side | 11.55 × 7.50 × 4.40 | 380 | MDMA (43.95%), Caffeine (49.27%) | 130.49 |
| 14 | 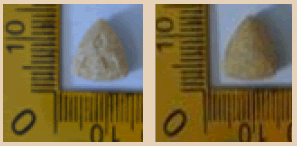 |
Brown | Logo Mitsubishi on one side | 11.15 × 11.15 × 5.65 | 365.1 | MDMA (26.66%), PMMA (1.25%), Caffeine (6.73%), Ketamin (63.70%) | 146.99 |
| 15 | 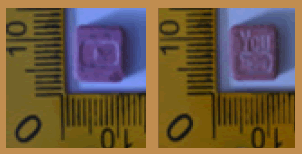 |
Pink | Logo and Marked ‘Youtube’ on both sides | 9.40 × 9.40 × 4.25 | 385.8 | MDMA (38.35%), Caffeine (53.44%) | 143.53 |
| 16 | 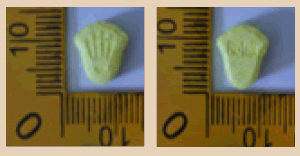 |
Yellow | Logo and Marked ‘Rolex’ on both sides | 9.95 × 10.65 × 5.80 | 400 | MDMA | 172.92 |
| 17 | 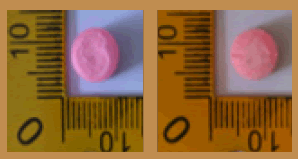 |
Pink | Logo Captagon on one side | 8.75 × 8.75 × 5.65 | 332.6 | MDMA | 138.83 |
| 18 | 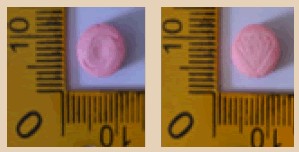 |
Pink | Logo Captagon on one side and Logo diamond on another side | 8.80 × 8.80 × 5.60 | 299.4 | MDMA | 132.32 |
| 19 | 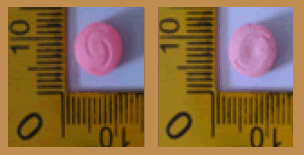 |
Pink | Logo Captagon on both sides | 8.80 × 8.80 × 6.10 | 328.1 | MDMA | 137.08 |
| 20 | 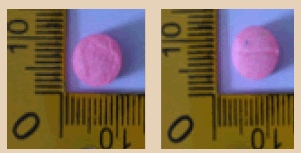 |
Pink | Logo Diamond on one side | 8.80 × 8.80 × 5.70 | 314.9 | MDMA | 131.50 |
| Note: *: Qualitative analysis was carried out using GC-MS. % sum area is calculated by dividing the area of each of substances identified by the total area and multiplying the resultant by 100%; **: Quantitative analysis was carried out using GC-FID; ***: Total analyzed samples were 24 ecstasy tablets. Samples 5-12 were seized in one case where 5, 6 and 7 each consisted of more than one similar sample from different packages (a, b, c indicated first, second and third sample, respectively). Each sample in code of 5, 6 and 7 was analyzed per individual sample. Samples 1 and 13 as well as 2 and 3 have similar appearance yet seized in different crime scenes. | |||||||
Table 1: Ecstasy tablet profiles.
Table 1 shows the variety of shapes, colors and logos of the ecstasy tablets. All tablets were mottled coloring. The weight of the investigated samples was in the range of 299.4-495.8 mg with an average weight of 350.42 mg. All ecstasy tablets were found to contain MDMA with or without other substances. The investigated tablets mainly contained MDMA as single active drug. Three samples contained caffeine in addition to MDMA. A combination use of caffeine tablet and MDMA was reported to lessen drowsiness and fatigue [2]. In addition, caffeine can potentiate the stimulant effect of MDMA due an increase of dopaminergic activity and produce greater long-term adverse effects when those drugs are administered together. Hyperthermia, which is one of the signs of an acute toxicity, will be increased by combination of MDMA and caffeine, leads to lethality [28].
A combination of MDMA and pharmaceutical drug, theophylline, was detected in sample 4. Multi compound tablets were identified where certain NPS namely PMMA was identified in 3 of 24 samples along with MDMA with adulteration of psycho stimulant-like substances, ketamine, or caffeine. Ecstasy tablet which contained drugs combination were reported to increase the risk adverse side effects that linked to increasing of death case based on FDA drug safety surveillance data [29].
In this study, the MDMA content expressed as MDMA hydrochloride was in between 102.38-216.78 mg, with an average of 145.76 mg MDMA hydrochloride per tablet. The blue minion tablet showed the highest content of MDMA though a little amount of theophylline was added to the composition.
Contrarily, the hexagonal light green tablet has a lowest MDMA content among others despite containing MDMA as single active drug with no adulterants. The presence of NPS PMMA and adulterants in multi compound tablets 2, 3, 14 did not decrease the MDMA hydrochloride content in each tablet, but increased the tablet weight of 2 and 3. Furthermore, the weight of tablet 14 was close to the average of all the investigated tablets. The amount of excipients involved may be less due to the addition of PMMA, Caffeine and Ketamine to the tablet.
The ecstasy tablets 1 which have identical physical appearance to tablet in different case in code of 13 showed the similar profile, as do the results of anion test and IR measurement. Furthermore, profile similarities can also be observed on tablets 17-20 which have a similar shape yet different logos. By these resemblances, 1 and 13 might come from the same production site, as well as 17-20. In contrast, tablets 5-12 which were seized in one crime scene and have a similar shapes and logos with variety of colouring agents applied, showing a quite large range of the MDMA content. For this case, they might come from the same or different production site which utilized two types of punches and various colouring agents. The diversity of MDMA content may due to inhomogeneous flow of mixture to compress [26]. However, impurity profiling is required to identify the chemical profile of each sample to classify and correlate link between seizures.
Conclusion
The ecstasy tablets seized in Indonesia during period of February to September 2023 exhibit several characteristics, which are found in the form of hydrochloride salt, mainly contained MDMA as single active drug, have an average weight and MDMA hydrochloride content of 350.42 mg and 145.76 mg, respectively. The composition of ecstasy tablet has no relationship to the MDMA content in each investigated tablet. Further investigation through chemical profiling can help to understand the correlation about similarities and differences profile between samples.
The database of ecstasy samples should be continuously updated to gather information about seized ecstasy profiles in Indonesia that can be used to analyze the pattern of ecstasy circulation and assist in the analysis of similar profile samples in the future. The database will also be beneficial for investigation and intelligence purposes.
Acknowledgements
The authors gratefully acknowledge Mr. Wahyu Widodo, the Head of Center of Drugs Testing Laboratory of National Narcotics Board (BNN) Republic of Indonesia for the support and valuable advice during the research. Authors also appreciate all the investigators for submitting ecstasy samples to our laboratory.
Funding
Nil
References
- (2023) The synthetic drug phenomenon. United Nations Office on Drugs and Crime: World Drug Report
- Papaseit E, Pérez-Mañá C, Torrens M, Farré A, Poyatos L, et al. (2020) MDMA interactions with pharmaceuticals and drugs of abuse. Expert Opin Drug Metab Toxicol 16: 357-369.
[Crossref], [Google Scholar], [Indexed]
- Kalant H (2001) The pharmacology and toxicology of “ecstasy” MDMA and related drugs. CMAJ 165: 917-928.
[Google Scholar], [Indexed]
- Mustafa NS, Bakar NHA, Mohamad N, Adnan LHM, Fauzi NFAM, et al. (2020) MDMA and the brain: A short review on the role of neurotransmitters in neurotoxicity. Basic Clin Neurosci 11: 381-388.
[Crossref], [Google Scholar], [Indexed]
- Górska AM, KamiÃ
?ska K, Wawrzczak-BargieÃ
?a A, Costa G, Morelli M, et al. (2018) Neurochemical and neurotoxic effects of MDMA (ecstasy) and caffeine after chronic combined administration in mice. Neurotox Res 33: 532-548.
[Crossref], [Google Scholar], [Indexed]
- United Nations Office on Drugs and Crime (2016) Terminology and information on drugs third edition. United Nations Publication, New York, USA.
- (2020) Drug fact sheet: Ecstasy/MDMA. Drug Enforcement Administration.
- Palamar JJ, Acosta P, Cleland CM (2019) Planned and unplanned drug use during a night out at an electronic dance music party. Subst Use Misuse 54: 885-893.
[Crossref], [Google Scholar], [Indexed]
- (2023) World Drug Report 2023: Special points of interests. United Nations Office on Drugs and Crime.
- (2023) Synthetic drugs in East and Southeast Asia: Latest developments and challenges. United Nations Office on Drugs and Crime.
- (2022) Indonesia drugs report 2022 pusat penelitian, data, dan informasi badan narkotika nasional. Badan Narkotika Nasional.
- (2023) Indonesia drugs report 2023 pusat penelitian, data, dan informasi badan narkotika nasional. Badan Narkotika Nasional.
- (2017) Global synthetic drug assessment: Amphetamine-type stimulants and new psychoactive substances. United Nations Office on Drugs and Crime
- Fagan P, Spálovská D, KuchaÃ
? M, Ã?ernohorský T, Komorousová L, et al. (2021) Ecstasy tablets: Rapid identification and determination of enantiomeric excess of MDMA. Forensic Chemistry 26: 100381.
[Crossref], [Google Scholar]
- Wood DM, Stribley V, Dargan PI, Davies S, Holt DW, et al. (2011) Variability in the 3,4-methylenedioxymethamphetamine content of ‘ecstasy’ tablets in the UK. Emerg Med J 28: 764-765.
[Crossref], [Google Scholar], [Indexed]
- Couchman L, Frinculescu A, Sobreira C, Shine T, Ramsey J, et al. (2019) Variability in content and dissolution profiles of MDMA tablets collected in the UK between 2001 and 2018-A potential risk to users? Drug Test Anal 11: 1172-1182.
[Crossref], [Google Scholar], [Indexed]
- (2023) European drug report 2023: Trends and developments. European Monitoring Centre for Drugs and Drug Addiction.
- Müller IB, Windberg CN (2005) Validation of an HPLC method for quantitation of MDMA in tablets. J Chromatogr Sci 43: 434-437.
[Crossref], [Google Scholar], [Indexed]
- Phonchai A, Janchawee B, Prutipanlai S, Thainchaiwattana S (2010) GC-FID optimization and validation for determination of 3,4-methylenedioxymethamphetamine, 3,4-methylenedioxyamphetamine and methamphetamine in ecstasy tablets. J Anal Chem 65: 951-959.
- Belafkih B, Belouafa S, Bennamara A, Skalli A, Abourriche A (2015) LC-MS/MS analysis of MDMA in ecstasy tablets in Morocco. J Forensic Res 6:5.
- Almeida NS, Benedito LEC, Maldaner AO, Oliveira ALD (2018) A validated NMR approach for MDMA quantification in ecstasy tablets. J Braz Chem Soc 29: 1944-1950.
[Crossref], [Google Scholar]
- Tanti, Tambunan CTM, Lalangi CA, Maimunah, Maulida EN (2022) Physical and chemical profiles of MDMA tablets seized in Indonesia. J Org Inorg Chem 8: 1-10.
- United Nations Office on Drugs and Crime (2006) Recommended methods for the identification and analysis of amphetamine, methamphetamine and their ring-substituted analogues in seized materials. United Nations Publication, New York, USA, pp-77.
- (2009) Screening colour test and specific colour tests for the detection of methylendioxyamphetamine and amphetamine type stimulants. Laboratory and Scientific Section.
- Cheng WC, Poon NL, Chan MF (2003) Chemical profiling of 3,4-Methylenedioxymethamphetamine (MDMA) tablets seized in Hong Kong. J Forensic Sci 48: 1249-1259.
[Google Scholar], [Indexed]
- Baer I (2007) The analysis of excipients in ecstasy tablets and their contribution in a drug profiling context.
- Balieiro AL, Santos RA, Pereira MM, Figueiredo RT, Freitas LS, et al. (2016) Adsorption process of molecularly imprinted silica for extraction of lactose from milk. Braz J Chem Eng 33: 361-372.
[Crossref], [Google Scholar]
- Camarasa J, Pubill D, Escubedo E (2006) Association of caffeine to MDMA does not increase antinociception but potentiates adverse effects of this recreational drug. Brain Res 1111: 72-82.
[Crossref], [Google Scholar], [Indexed]
- Cohen IV, Makunts T, Abagyan R, Thomas K (2021) Concomitant drugs associated with increased mortality for MDMA users reported in a drug safety surveillance database. Sci Rep 11: 5997.
[Crossref], [Google Scholar], [Indexed]
Open Access Journals
- Aquaculture & Veterinary Science
- Chemistry & Chemical Sciences
- Clinical Sciences
- Engineering
- General Science
- Genetics & Molecular Biology
- Health Care & Nursing
- Immunology & Microbiology
- Materials Science
- Mathematics & Physics
- Medical Sciences
- Neurology & Psychiatry
- Oncology & Cancer Science
- Pharmaceutical Sciences